
Analytics Dashboard
Workspace-level analytics, compliance trends, historical data
3 min read•Article 8 of 9 in Reports & Analytics
Analytics Dashboard
The Analytics Dashboard provides workspace-level insights into your compliance posture over time.
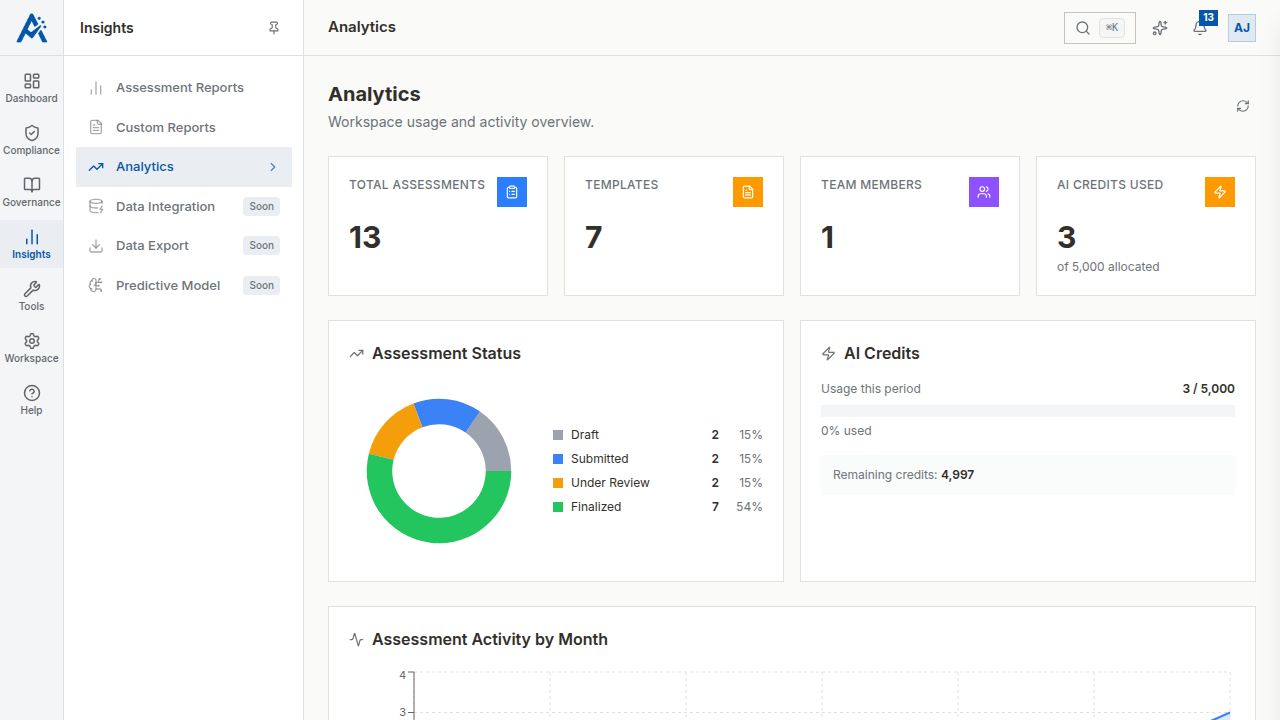
Accessing Analytics
Navigate to Analytics in the sidebar to view workspace-wide metrics and trends.
Key Metrics
Compliance Score Trend
- •Line chart showing how your overall compliance score has changed over time
- •Identify improvement or regression patterns
- •Filter by framework, project, or time period
- •Per-framework readiness uses locked-in weekly snapshots taken on the Monday of your tenant's local week — historical points never shift retroactively, and the next data point lands on the following local Monday
Assessment Volume
- •Number of assessments created, in progress, and completed
- •Monthly and quarterly breakdowns
- •Comparison to previous periods
Domain Performance
- •Average scores across all assessments by domain
- •Identify consistently strong or weak areas
- •Track domain-level improvements
Finding Trends
- •Number of findings by severity over time
- •Resolution rates and average time to resolve
- •Most common finding categories
Filters and Options
Customize your analytics view with:
- •Date range — Focus on specific time periods
- •Framework — Filter by compliance framework
- •Project — View analytics for specific projects
- •Template — See trends for a specific template
Using Analytics Effectively
- •Review analytics monthly to track compliance trajectory
- •Use domain performance data to prioritize improvement efforts
- •Monitor finding trends to identify systemic issues
- •Share analytics with leadership for compliance reporting
- •Compare performance across different frameworks or business units